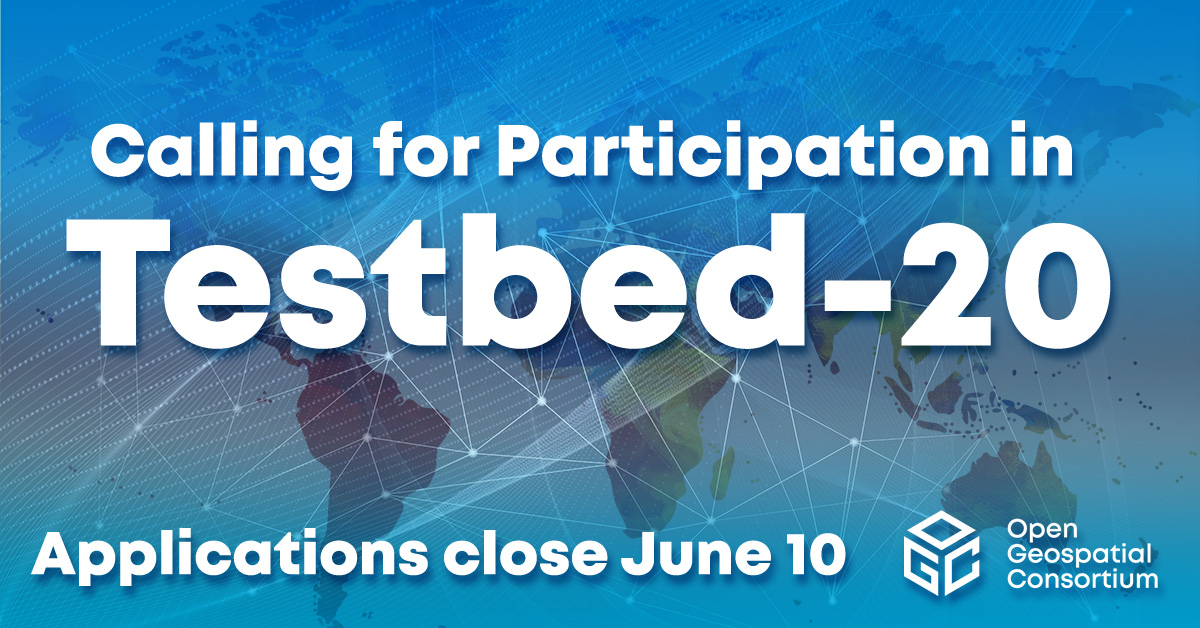
Advancing the Foundations of Interoperability: OGC Testbed-20 Calls For Participation
Testbed-20 will drive innovation at the foundations of geospatial data ecosystems, with new imagery, new HPC, and new data cubes.


OGC is a consortium of experts committed to improving access to geospatial, or location information. We connect people, communities, and technology to solve global challenges and address everyday needs.
We represent over 500 businesses, government agencies, research organizations, and universities united with a desire to make location information FAIR – Findable, Accessible, Interoperable, and Reusable.


OGC is the home of geospatial innovation, collaboration, and standards. We are an international membership organisation that supports a diverse community of 500+ businesses, government agencies, research organizations, and universities, all working together to make location information FAIR – Findable, Accessible, Interoperable, and Reusable.
Our membership is driven, open, diverse, inclusive, accessible, and made up of fortune 500 organizations, governments, academic hubs for innovation, startups that are changing the location of landscape, and more.
Total Members
New Members in 2022
Principal Members
Strategic Members
OGC manages an agile and collaborative research and development process — the OGC Collaborative Solutions and Innovation Program – that anticipates and solves real-world geospatial challenges experienced by our members.
Ensure that standards represent diverse perspectives and utilize the best in current technology by providing feedback on a potential standard or working group.
Help bring this work to life by conducting experiments, undertaking research, developing prototype solutions, and more.

Receive the latest news on OGC.
© 2024 Open Geospatial Consortium. All Rights Reserved.